Hey folks! I'm proud to announce the first open source release of my sqltop tool! sqltop is an interactive command-line based tool to view active sessions on a SQL Server instance. In this post I'll talk about why I wrote the tool, why I chose to write it in PowerShell, and walk through some of the challenges I faced during development.
Why?
For those not familiar with the Linux command line, there is a fantastic tool called top, and a slightly more fantastic tool called htop. To over simplify, these tools allow you to see a real-time view of the processes running on the system. This includes the path to the executable, the user running the process, resources being consumed, etc. sqltop is an attempt to bring the same tools to SQL Server.
It's not meant to replace monitoring, or even the many well known community tools. It's just meant as another tool to have in your tool belt when trying to troubleshoot performance issues on busy servers. This need is highly driven by the environment I work in. If something goes wrong and work starts to pile up, a server can quickly get to the point where running things like sp_who2 won't even return results. Because of this we needed something we could use in almost any situation that would give us all the info we would need to start triaging an issue.
What's in the box?
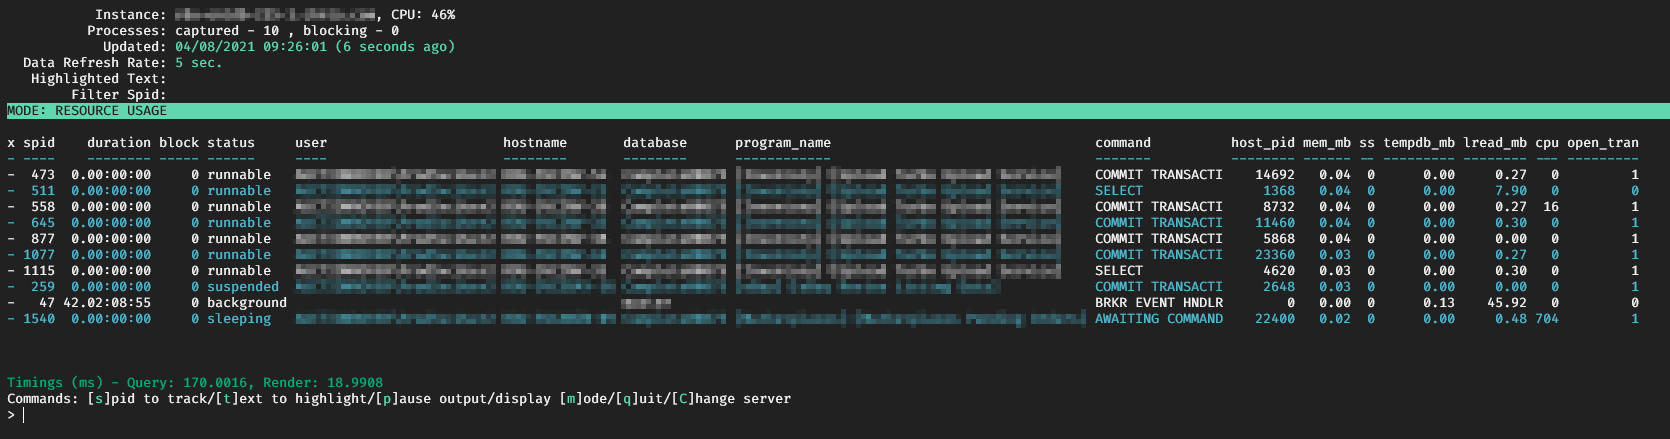
As you can see in the screenshot above, sqltop shows most of the basics you'd expect, as well as a few extra things like multiple lines if a session is running a parallel task, and an indicator if the session is taking part in a snapshot transaction.
One feature that sets this tool apart is the display refresh. The display refreshes every 5 seconds with new data from the server. If the server is under extreme load the data refresh process will slowly back off, increasing time between refreshes, until the server starts responding faster. The auto-refresh alone is a handy feature but you can also:
- Highlight sessions based on an arbitrary text search string
- Capture plans and sql text for a specific session, or even kill a running session
- Track a running session over time to watch as it accumulates waits and resource usage stats
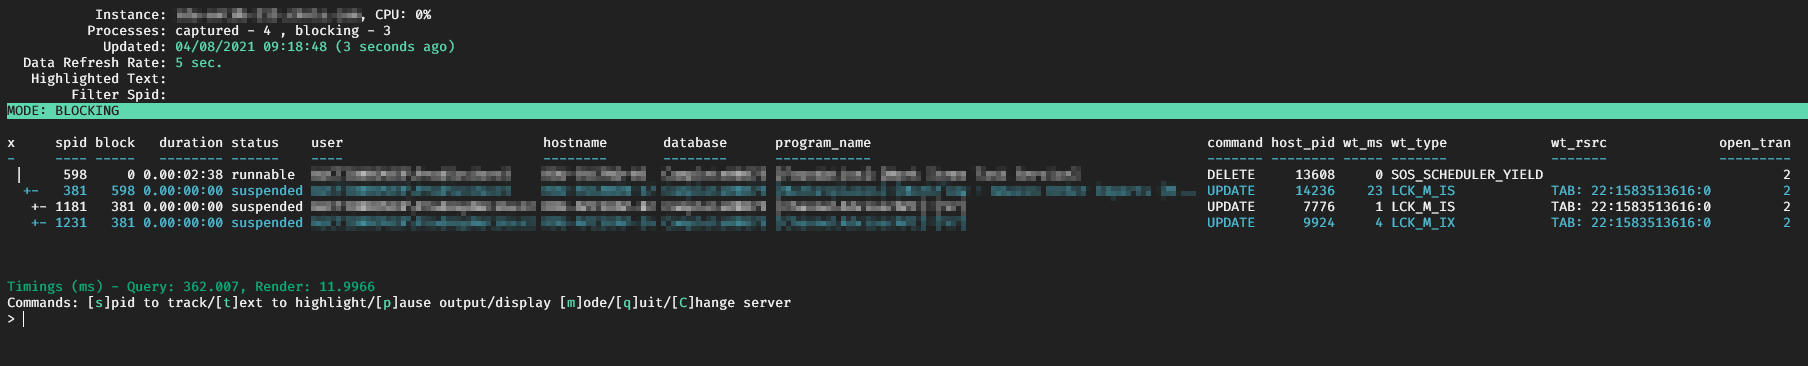
You can also switch between a number of views to see the data in a different way. For example you can see waits by session, cumulative waits for all sessions, resource usage by program or stored procedure call, and even a blocking tree view:
Why PowerShell?
Probably one of the first things folks ask me about this tool is "Why PowerShell?". Why indeed. PowerShell is 100% not the best language to write an interactive CLI app. That being said, my initial goal with sqltop was to get more experience working with PowerShell runspaces, specifically passing data around between them. I learn by doing so I grabbed a diagnostic query I had been working on and decided to put a quick UI around it. If I had known we would actually end up using it and eventually open-sourcing the project I might have written it in Go or Python. But here we are.
Using PowerShell for this project turned out to be very educational as I ran into a lot of strange challenges I had to overcome. For the remainder of this post I'll go over the more interesting challenges and what my ultimate solution was.
Quick Note: Throughout this project I am sure there are places where external modules would have helped, but I wanted to keep it as lean and self-contained as possible. I spent a lot of time shaving milliseconds off here and there to make the UI a smooth experience, introducing external modules would likely not have made this task easier.
Sharing data and state
sqltop uses a separate runspace to retrieve information from SQL. This process runs separate from the UI loop. This model gave me a ton of flexibility as the UI is never blocked by the process that queries for session information. This allows for a smooth user experience as the UI can respond to commands almost immediately.
To accomplish this separation, I needed to figure out how best to pass query result data to the UI, and also have UI driven events change the state of the process running the queries and collecting data. What I ended up using a was a Synchronized Hashtable.
Creating a syncronized hashtable is pretty simple:
$StateData = [hashtable]::Synchronized(@{})
This creates a threadsafe hashtable, allowing us to access this variable from both the session the UI code is running on, and the runspace code the data retrieval code is running on.
Next I had to create a new runspace and inject this variable into it:
$newRunspace = [runspacefactory]::CreateRunspace()
$newRunspace.Open()
$newRunspace.SessionStateProxy.SetVariable("StateData",$StateData)
Now that we have $StateData available in both the current session and the runspace, we can do things like run a SQL query and store the results in $StateData.Results, making those results available to the UI. For some additional safety I also added a boolean property to the hashtable called Lock. This gets set to $True at the beginning of the UI loop and prevents the result data from being updated while the display is being drawn.
I learned a lot getting this portion of the code to work and ended up using quite a few special properties to send signals between the UI and data processes.
Invoke-Sqlcmd
Invoke-Sqlcmd is typically your go-to when you need to query SQL Server. Sure it has it's odd behaviors, but overall it's reliable. This is not the case when you try to run Invoke-Sqlcmd from within a new runspace. Within a runspace I ran into a lot of odd error messages (which I have forgotten about as it's a been a while) and odd behavior in error cases. In this case the solution was simple, I just used .NET objects directly:
$Conn = [System.Data.Sqlclient.SqlConnection]::new()
$Conn.ConnectionString = $ConnectionString
$Conn.Open()
$Cmd = [System.Data.Sqlclient.SqlCommand]::new()
$Cmd.CommandText = $Query
$Cmd.CommandTimeout = 108000
$Cmd.Connection = $Conn
$SqlAdapter = New-Object System.Data.SqlClient.SqlDataAdapter
$SqlAdapter.SelectCommand = $Cmd
$DataSet = New-Object System.Data.DataSet
$null = $SqlAdapter.Fill($DataSet)
$Results = $DataSet.Tables[0].Rows
The query I am running is a known quantity so the code to execute it didn't really need to be that robust. I didn't put specific error handling code in either, as if the data retrieval code fails in any, it passes the error message directly to the UI to let the user know what's happening.
Color!
While this may not seem super important at first, color ended up being important to the interface and allowed for some interesting interactions. The biggest challenge related to multi-color display is doing things like highlighting specific words or lines in a multi-line output with a different color. For example, there is no way to output a table with alternating colored lines using with standard PowerShell functions.
This was accomplished by converting the output (in normal powershell table format) into a string using Out-String -Stream. This converts what would have been displayed on the screen into a string, and -Stream emits it line-by-line. It is then piped through ForEach-Object. Following this pattern I can now count which line I am on an decide to make the line a different color (for alternating row colors) or I can search the line for a given search string and highlight the line.
Now that I have this line-by-line control I simply used color escape codes to color the output. Escape codes allow you to color down to the individual character so it gives you a lot of control and flexibility. The only issue is that it is a little verbose to use, so I wrote a small helper function called color:
function color {
    param(
        $Text,
        $ForegroundColor = 'default',
        $BackgroundColor = 'default'
    )
    # Terminal Colors
    $Colors = @{
        "default" = @(40,50)
        "black" = @(30,0)
        "lightgrey" = @(33,43)
        "grey" = @(37,47)
        "darkgrey" = @(90,100)
        "red" = @(91,101)
        "darkred" = @(31,41)
        "green" = @(92,102)
        "darkgreen" = @(32,42)
        "yellow" = @(93,103)
        "white" = @(97,107)
        "brightblue" = @(94,104)
        "darkblue" = @(34,44)
        "indigo" = @(35,45)
        "cyan" = @(96,106)
        "darkcyan" = @(36,46)
    }

    if ( $ForegroundColor -notin $Colors.Keys -or $BackgroundColor -notin $Colors.Keys) {
        Write-Error "Invalid color choice!" -ErrorAction Stop
    }

    "$([char]27)[$($colors[$ForegroundColor][0])m$([char]27)[$($colors[$BackgroundColor][1])m$($Text)$([char]27)[0m"
}
Using these methods I construct one big string object (complete with newline characters) and write it to the screen all at once. Here it is in use to handle alternating colors as well as highlighting a line if the given search string is found and appending to my final output string $ResultString:
Out-String -Width $Host.UI.RawUI.WindowSize.Width -Stream | ForEach-Object {
    # Handle special coloring here
    $Row += 1
    if ( $filter -and -not $StateData.SpidFilter -and $_.ToLower().Contains("$($filter.ToLower())") ) {
        $ResultString += "$(color $_ "black" "white")`n"
    } elseif ( $Row % 2 -eq 1 ) {
        $ResultString += "$(color $_ "cyan" "default")`n"
    } else {
        $ResultString += "$($_)`n"
    }
}
In the example I am using the $Row variable to determine if I am on an even or odd row and coloring accordingly.
Display fields and sorting
I went through a few iterations before I landed on an interesting method of setting the field display and sorting options that control each of the views. As I mentioned in the previous section, to draw the display I just output one big string. That string is created by pipeing the results from the data process into Sort-Object and Format-Table. To make it easy to add new views using this model, most of the view and display options are stored in two different hashtables: $DisplayColumns and $SortOptions. Each hashtable contains a number of other hashtables I then use to pass arguments to Sort-object and Format-Table via splatting. Here is a snippet of the $DisplayColumns:
$DisplayColumns = @{
    'Object Tracking' = (
        'object',
        'workers',
        'blocked',
        'cpu',
        @{
            Name = 'mem_mb'
            Expression = { "{0:0.00}" -f $_.mem_mb }
            Alignment = "right"
        },
        @{
            Name = 'tempdb_mb'
            Expression = { "{0:0.00}" -f $_.tempdb_mb }
            Alignment = "right"
        },
        @{
            Name = 'lread_mb'
            Expression = { "{0:0.00}" -f $_.lread_mb }
            Alignment = "right"
        }
    )
    'Waits' = (
        'x',
        'spid',
        @{
            Name='duration'
            Expression={([timespan]::fromseconds($_.dur_sec)).ToString('d\.hh\:mm\:ss')}
            Alignment = "right"
        },
        'block',
        'status',
        'user',
        'database',
        'program_name',
        'command',
        'wt_ms',
        'wt_type',
        'wt_rsrc',
        'open_tran'
    )
}
Here you can see we have two entries (there are more in the actual code), Object Tracking and Waits. Based on the view the user chooses I just store the entry from $DisplayColumns in a separate variable and pass it to Format-Table:
# Set the sort and display options
$SortOpt = $SortOptions["$($StateData.DisplayMode)"]
$DisplayOpt = $DisplayColumns["$($StateData.DisplayMode)$($SubDisplayMode)"]

...

Sort-Object -Property $SortOpt | Select-Object -First $max_display | `
    Format-Table -Property $DisplayOpt -Wrap | `
    Out-String -Width $Host.UI.RawUI.WindowSize.Width -Stream | `
    # This is where we pipe to the colorizing code from the previous section
While I still have some code to clean up, this method has worked great and makes it really easy to add new views.
final thoughts
Like I said earlier, if I could do this project over again (knowing it would turn into a useful tool) I would have likely written in something like Python, but it turned out to be a highly educational experience. The techniques I used while creating this tool have been reused a lot in other code in our various internal modules so beyond the educational value it has also served to improve our code quality (or at least the UX quality) in general. Please check out the code for this project over at Github. I'd love feedback on things I could do better, or new features folks would like to see.