baselining sql server with the tig stack
estimated read time: 9-12 minutes
This post is part of T-SQL Tuesday. Thanks to my buddy Anthony Nocentino for hosting this month's T-SQL Tuesday! Anthony is big in the container space so this month's posts are answering the question "What have you been up to with containers?". Check out his post here.
In this post I am going to introduce you to the TIG stack (Telegraf, InfluxDB, Grafana) as a way to collect performance baseline metrics from your SQL Server instances. I will also introduce an open source project I created to get you off the ground and running in a few minutes. If you already use this stack, this project can be a great way to test new versions of the various components, and a great place to do local development on new dashboards.
tig?
Outside of an older post when I released the re-write of the Telegraf plugin for SQL Server, I haven't said much about the TIG stack. The TIG stack is a collection of 3 open source projects that combine to create a highly scalable performance metric capturing system.
- Telegraf is a metrics collector agent that can run either directly on the host it is collecting data from, or from a central location. Telegraf is responsible for gathering metric data and writing it to InfluxDB.
- InfluxDB is a high-performance time-series database designed specifically to ingest metrics and time-based data.
- Grafana is the final piece of the puzzle providing a data visualization layer for creating complex dashboards. Grafana queries the data in InfluxDB and generates highly configurable charts, graphs, and tables to display the data in customizable dashboards.
why?
Lots of folks wonder why I would go through the trouble of building out a system when so many vendors have already solved the problem of collecting baseline metrics. The answer at the time was simple: cost. With my setup I could monitor close to 600 instances (including dev) for $3,000 USD per year. That includes data retention of ~2 years! Are there some administration costs as far as my time is concerned? Of course. In the begining things were a little rough as I learned more about InfluxDB, but once things were configured correctly the most work I've had to do is to expand the size of the data drive as we started collecting more metrics.
If you want to hear more thoughts on monitoring and vendor-based solutions, check out this episode of Mixed Extents!
my setup
As I said above, where I work we gather detailed performance metrics on all of our 600+ instances every 30 seconds. Costs have gone up a little since I initially set everything up to accommodate for more data points, and an expanded retention period of ~5 years. Generally though, we run a Telegraf client on each machine, have a single InfluxDB instance in AWS, and a single Grafana instance. Generally speaking you could easily run Grafana and InfluxDB on the same box. The big limiting factor here is memory, so I have plenty of CPU to spare on the InfluxDB instance. Since Grafana is simply acting as a data proxy between the user and the InfluxDB server, you could get away with running it on a free-tier server for quite a while without much issue. Look for future posts where I share a bit more about the operational day-to-day of maintaining this configuration.
enter stig
STIG is a docker-compose based method to quickly spin up the infrastructure you need to start playing around with a SQL Server TIG stack. With a simple config tweak you can have a working TIG stack running on a test server (or your laptop) in a few minutes. The first thing you need to do is clone the repo:
git clone https://github.com/m82labs/stig.git
There are a few directories and files in the project, but really only one you have to worry about to get things up and running:
- config - User configurable values are set in the config file
userconfig.yamlin this directory - grafana - The datasources and sample dashboard for Grafana are located here, you should not need to alter these
- src - The source code for a simple python script that uses
userconfig.yamlto generate a workingtelegraf.conffile on build - telegraf - Contains the
telegraf.conf.tempfile. This file should typically not be altered unless you really know what you are doing, as it is just a template file used by a python script to create the final config.
configuration
Currently the only configuration a you have to worry about is the connection details for the SQL Server instance you want to capture data from. To add an instance, open the config/userconfig.yaml file and add any number of hosts in the following format:
telegraf:
  sql_plugin:
    hosts:
      - host: 192.168.1.2
        port: 1433
        username: telegraf
        password: TelegrafPassword0!
      - host: 192.168.1.3
        port: 1433
        username: telegraf
        password: TelegrafPassword0!
Before you can spin up STIG you need to make sure you also have a telegraf user created on the instances you want to manage. The permissions needed are pretty straightforward:
USE master;
GO
CREATE LOGIN [telegraf] WITH PASSWORD = N'<your_strong_password>';
GO
GRANT VIEW SERVER STATE TO [telegraf];
GO
GRANT VIEW ANY DEFINITION TO [telegraf];
GO
run it!
Starting up STIG is simple, just change to the root directory of the repo and run:
docker-compose up
This command will be followed by some output telling you what is happening. This is nice as you can quickly see if you got something wrong, for example:
Creating volume "stig_influx_data" with default driver
Creating volume "stig_grafana_data" with default driver
Creating stig_influxdb_1 ... done
Creating stig_config_1   ... done
Creating stig_grafana_1  ...
Creating stig_grafana_1  ... error
WARNING: Host is already in use by another container

ERROR: for stig_grafana_1  Cannot start service grafana: driver failed programming external connectivity on endpoint stig_grafana_1 (32b5d854eeb3966fbd42d3a6a5f8076bd36bd0aab4dba0eaddCreating stig_telegraf_1 ... done

ERROR: for grafana  Cannot start service grafana: driver failed programming external connectivity on endpoint stig_grafana_1 (32b5d854eeb3966fbd42d3a6a5f8076bd36bd0aab4dba0eadd2eaba2e3919ad9): Error starting userland proxy: listen tcp4 0.0.0.0:8080: bind: address already in use
This just means that something else is already using port 8080, so the Grafana container can't start. There are a number of errors you could run into, but they should all be displayed immediately, and typically be easy to understand.
Assuming everything is up and running, you should now be able to connect to http://localhost:8080 to access your Grafana install. By default the username is stig and the password is stigPass!.
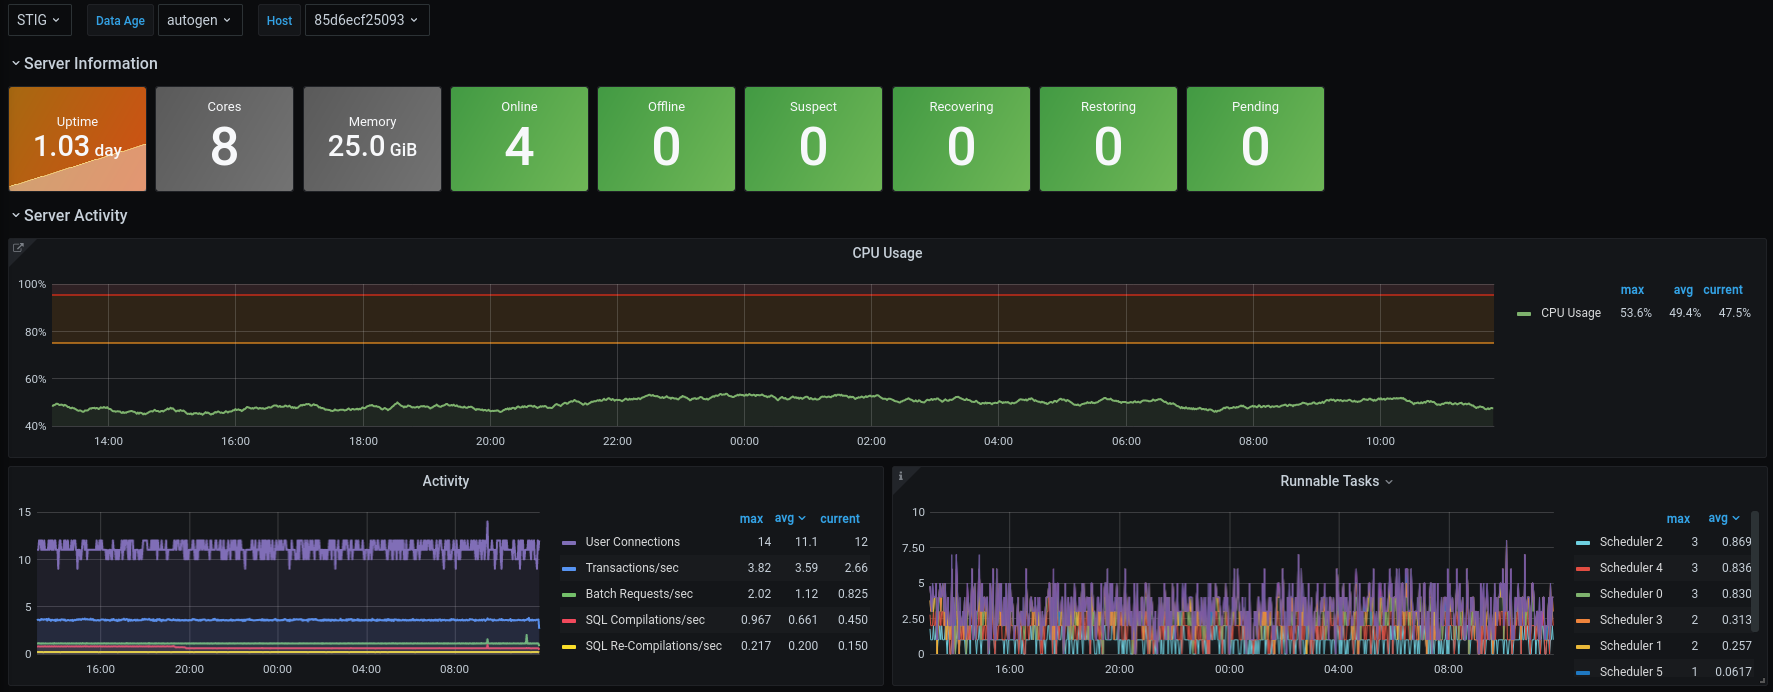
notes on altering the dashboard
Since the dashboard that ships with this project is imported on build, you can't modify it directly. Instead, you'll need to make a copy. To make a copy, open the dashboard and click on the settings icon (a gear) at the top:

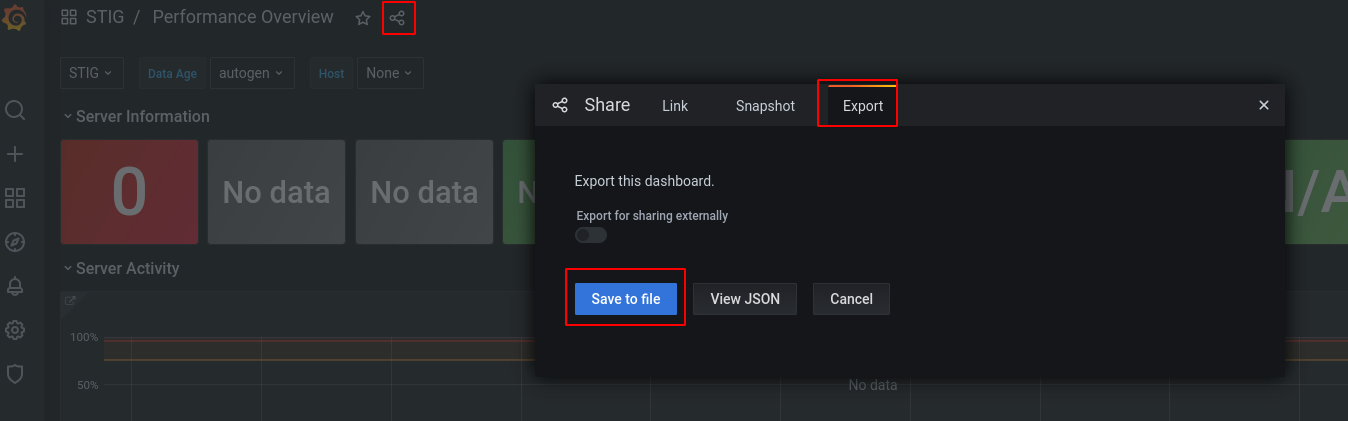
You can then choose Save As to make your own copy of the dashboard. If you end up creating a dashboard you think you want to use on another Grafana instance you can export the dashboard to a file by selecting the Share icon at the top and clicking on the Export tab:
shutting it down
Stopping STIG is just as easy as starting it:
docker-compose down
This will gracefully shut all the containers down. The containers are still there though, so issuing another docker-compse up command would get you back to where you were. If you want to completely remove the containers you'll need to issue another command:
docker-compose rm
This will ask you to confirm and then completely delete the container instances from your machine. This command will NOT remove the data collected by STIG though, I'll talk about that a bit more in the next section.
notes on persistent data
This compose file uses named volumes to retain data captured with STIG. You could run an hour worth of capture, destroy the whole setup, and start it up again and still have access to your data. To view the volumes currently set up you can run:
docker volume ls
This should display a list of volumes, in it you'll see the volumes used by stig:
DRIVER    VOLUME NAME
local     stig_grafana_data
local     stig_influx_data
You can get more detailed information on these volumes (like the location of the volumes on your local file system) using the docker volume inspect command:
docker volume inspect stig_influx_data
This will output some useful info:
[
    {
        "CreatedAt": "2021-07-07T13:57:50-04:00",
        "Driver": "local",
        "Labels": {
            "com.docker.compose.project": "stig",
            "com.docker.compose.version": "1.25.0",
            "com.docker.compose.volume": "grafana_data"
        },
        "Mountpoint": "/var/lib/docker/volumes/stig_grafana_data/_data",
        "Name": "stig_grafana_data",
        "Options": null,
        "Scope": "local"
    }
]
This lets us know that the volume itself is storing data locally at /var/lib/docker/volumes/stig_grafana_data/_data, and tells us when it was created.
If you ever want to delete those volumes and reclaim some space, you can easily delete them:
docker volume rm stig_influx_data stig_grafana_data
next steps
While running TIG in production is a bit more involved this project does give you an easy way to get it up and running and start investigating how each component works. Below are some great resources so you can start exploring:
- Grafana Resources - The Grafana documentation is a great place to start. The docs are well written with a heavy focus on getting things done.
- InfluxDB Concepts - This is a specific section of the documentation on important concepts to understand when working with InfluxDB. The rest of the documentation is also fantastic and give you some good foundational knowledge to do more with InfluxDb.
- InfluxDb Continuous Queries - While part of that same documentation I think
continuous querieswarrant being called out specifically. This is an amazing feature that allows you to easily re-aggregate data in any way you see fit, on a scheduled basis, automatically. One primary use of this feature it to reduce granularity of metrics for long term storage. Say you want to keep the last weeks worth of metrics at a 10 second granularity, the last months at an hourly granularity, and anything older at a 6 hour granularity. With continuous queries you can get all of that with three commands. This allows you to keep long-term trending data while also minimizing storage consumption. - Telegraf SQL Server Plugin - A direct link to the SQL Server plugin for Telegraf. This is the plugin that queries your SQL Server instance for metrics and writes them to InfluxDB. If you go one level higher you can see that Telegraf has an enormous number of plugins capable of getting metrics from most popular backend systems.
Also, keep your eyes open for more blog posts about using this setup in a large production environment.