retrieving deadlock graphs with powershell
estimated read time: 9-12 minutes
Before we dive into some extended events and PowerShell fun I want to say thanks to Jes Borland (WWW/Twitter) for hosting this months T-SQL Tuesday! If you are interested in learning more about T-SQL Tuesday, take a look at Jes's post, and check out the #tsqltuesday hashtag on Twitter.
System Health
Extended Events can be intimidating to start working with. You have to choose which events you want to capture, how you want to store it, and how you want to filter it. Scrolling through the available event list alone can be a little overwhelming. Thankfully SQL Server ships with the handy system_health extended event (XE going forward) session already set up and running.
The system health XE session has an amazing amount of information in it. Do you have some long-waiting tasks? Check system health. Need CPU history? Check system health. Connection errors? Check system health. Sev 20+ errors? Check system health. There's a lot more information available in this XE session, but for now we are just going to focus on one: deadlocks.
Viewing Deadlocks in System Health
Before we query system health for deadlocks, let's take a look at it in SSMS. Getting there is pretty simple, once connected to an instance via the object explorer, just go to Management > Extended Events > Sessions > system_health:
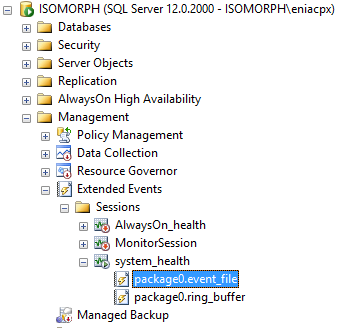
To view the session data, double-click on package0.event_file. Once it opens up you'll see the default layout, which include two columns name and timestamp. The name column contains the name of the event type that was captured, and the timestamp tells you when it happened, single-clicking on any of these events will show more detail at the bottom of the window:
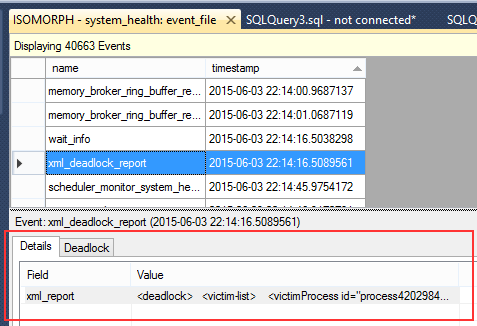
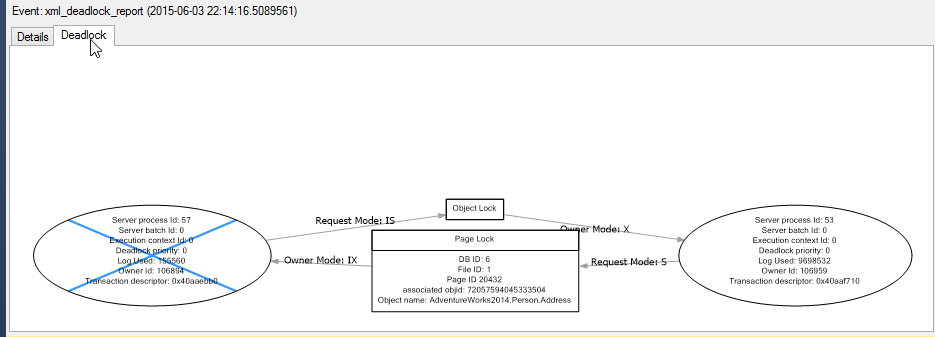
In this case we found a deadlock graph, and as you can see the beginning of the deadlock XML is shown. If you now click on the 'Deadlock' tab, you can see the graphical representation of the deadlock:
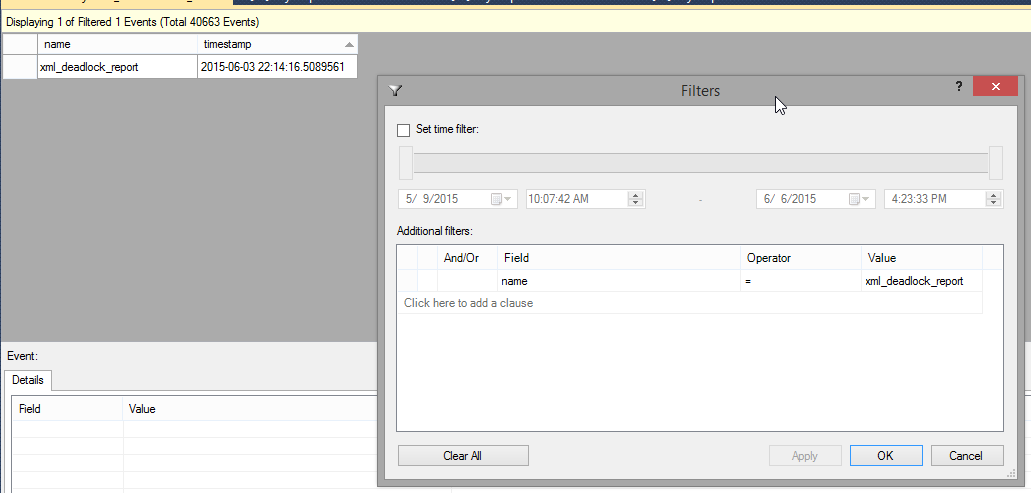
When looking at your system health session using SSMS, make sure you also take advantage of it's filtering capabilites, you can filter on both the timestamp and event name. To set up a filter just click on the 'Filters...' button in the toolbar at the top of the window. Below you can see how I would set up a filter to just show deadlocks (this test system only has a single deadlock):
I highly recommend taking a look around at some other events and see what you can find. There is a lot of documentation out there on system health, so find something interesting in yours and google it. You'll be surprised how much information is available.
Querying Deadlocks From System Health
Writing queries to get data out of extended events sessions can get complicated fast. To keep things simple we are going to use the ring buffer target for our queries. This isn't always the best approach, but for our purposes it will work. If you were going to set something up to grab deadlock graphs on a regular basis in a production environment I would recommend, without hesitation, that you do the work of querying the file target. To learn more about this process, check the resources section at the end of this post for a great article from Jonathan Kehayias.
Here is a simple script to grab deadlock graphs:
DECLARE @system_health XML

-- Copy ring buffer into an XML variable
SELECT
    @system_health = CAST(xet.target_data AS XML)
FROM
    sys.dm_xe_session_targets xet
    INNER JOIN sys.dm_xe_sessions xe
        ON xe.address = xet.event_session_address
WHERE
    xe.name = 'system_health'
    AND xet.target_name = 'ring_buffer'

-- Get the time stamp and deadlock graph
SELECT
    xed.value('@timestamp','datetime'),
    xed.query('.')
FROM
    @system_health.nodes('RingBufferTarget/event[@name="xml_deadlock_report"]') AS XEventData(xed)
We have a few things going here:
- First we copy data from the ring buffer directly into an XML variable. This simple operation can speed up XML parsing tremendously
- Next we use the
nodes()method of the XML variable to extract all event elements with an event name ofxml_deadlock_report
The nodes() method is an important thing to understand when dealing with XML data like that found in extended events sessions. Basically nodes() is a function that returns XML elements as row data. What this means is that when you select FROM it, each row is an independent lump of XML data. In the above query our call to nodes() will return one row per xml_deadlock_report event that has been captured.
To extract useful information we are using the value and query methods. value takes the name of an attribute (timestamp in this case) or the path to a sub-element, and converts the value into the datatype specified. query takes an XQuery and returns an XML object, in our case we are specifying '.' which just means 'return everything'.
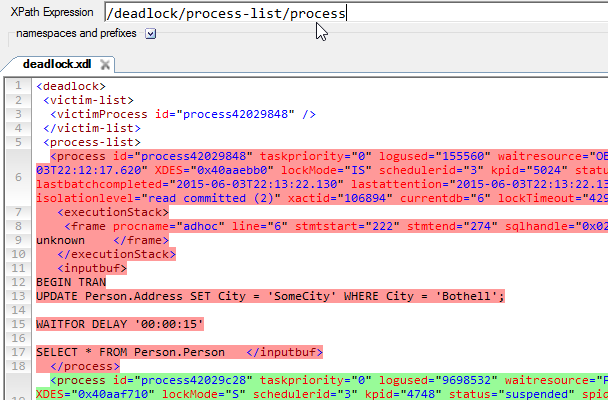
If you have never written XQuery before I suggest downloading XPath Visualizer. With this tool you can open an XML deadlock graph (or a query plan for that matter) and immediately see the effects of an XQuery:
Querying with PowerShell
So with all of that out of the way, lets do what we set out to do from the start. We already have the query to get our XML deadlock graphs, now we are going to combine it with a little PowerShell.
# ==== Deadlock Test Script ---------------------------------------------------
[string]$instance = 'localhost'
# ====-------------------------------------------------------------------------

# ==== Set up the script ------------------------------------------------------
$get_deadlocks = '
DECLARE @system_health XML

-- Copy ring buffer into an XML variable
SELECT
    @system_health = CAST(xet.target_data AS XML)
FROM
    sys.dm_xe_session_targets xet
    INNER JOIN sys.dm_xe_sessions xe
        ON xe.address = xet.event_session_address
WHERE
    xe.name = ''system_health''
    AND xet.target_name = ''ring_buffer''

-- Get the time stamp and deadlock graph
SELECT
    xed.value(''@timestamp'',''datetime'') AS timestamp,
    xed.query(''.'') As deadlockReport
FROM
    @system_health.nodes(''RingBufferTarget/event[@name="xml_deadlock_report"]'') AS XEventData(xed);
'

# ==== Run the prepared script, output to object ------------------------------
$results = Invoke-Sqlcmd -ServerInstance $instance -Query $get_deadlocks

# ==== Output to screen -------------------------------------------------------
$results | Format-Table -AutoSize
# ====-------------------------------------------------------------------------
At this point you have your timestamp and the XML deadlock graph. Now all we need to do is write this out to a file. With PowerShell this is pretty trivial using the Out-File cmdlet. We simply loop through the results, create a unique file name, then save it.
...
Foreach( $result IN $results ) {
    # Generate a output file path
    [string]$timestring = '{0:yyyyMMdd-HHmmssfff}' -f [datetime]$result.timestamp
    [string]$outfile = "$outpath$instance_$timestring-" + ((Get-Random) % 100).ToString() + "_deadlock.xdl"
    Write-Host "Writing file: $outfile"
    try {
        Out-File -InputObject ($result.deadlockReport) -FilePath $outfile
    } catch {
        Write-Host "Writing file $outfile failed: $_"
    }
}
...
Cool, now if you go check you output directory (we used C:\temp), you should see some deadlock graph XDL files in there. Double-clicking on one should open it in SSMS for you to view, but in our case it just returns an error:

If you open your deadlock graph in a text editor, you'll see that the XML ends kind of abruptly:
...
</frame></executionStack><inputbuf>
Proc [Database Id = 11 Object Id = 665274371]   </inputbuf></process></process-list><resource-list><keylock hobtid=
So it looks like our file was truncated. But why would that be? The answer lies in the Invoke-SqlCmd cmdlet. By default it only allows a maximum of 4000 characters per column to be returned. Luckily we can override this behavior using the -MaxCharLength parameter. I was unable to find a max value for this parameter, but I find using a very large number works just fine:
...
# ==== Run the prepared script, output to object ------------------------------
$results = Invoke-Sqlcmd -ServerInstance $instance -Query $get_deadlocks  -MaxCharLength 1000000
...
Now when we run our script and try to open one of our deadlock files we should be able to view both the graph and XML data in SSMS.
Here is our final script:
# ==== Deadlock Test Script ---------------------------------------------------
[string]$instance = 'instance_name'
[string]$outpath = 'C:\temp\'
# ====-------------------------------------------------------------------------

# ==== Set up the script, then replace the variables --------------------------
$get_deadlocks = '
DECLARE @system_health XML

-- Copy ring buffer into an XML variable
SELECT
    @system_health = CAST(xet.target_data AS XML)
FROM
    sys.dm_xe_session_targets xet
    INNER JOIN sys.dm_xe_sessions xe
        ON xe.address = xet.event_session_address
WHERE
    xe.name = ''system_health''
    AND xet.target_name = ''ring_buffer''

-- Get the time stamp and deadlock graph
SELECT
    xed.value(''@timestamp'',''datetime'') AS timestamp,
    xed.query(''.'') As deadlockReport
FROM
    @system_health.nodes(''RingBufferTarget/event[@name="xml_deadlock_report"]'') AS XEventData(xed);
'

# ==== Run the prepared script, output to object ------------------------------
$results = Invoke-Sqlcmd -ServerInstance $instance -Query $get_deadlocks  -MaxCharLength 1000000

# ==== Output to screen -------------------------------------------------------
$results | Format-Table -AutoSize
# ====-------------------------------------------------------------------------

Foreach( $result IN $results ) {
    # Generate a output file path
    [string]$timestring = '{0:yyyyMMdd-HHmmssfff}' -f [datetime]$result.timestamp
    [string]$outfile = "$outpath$instance_$timestring-" + ((Get-Random) % 100).ToString() + "_deadlock.xdl"
    Write-Host "Writing file: $outfile"
    try {
        Out-File -InputObject ($result.deadlockReport) -FilePath $outfile
    } catch {
        Write-Host "Writing file $outfile failed: $_"
    }
}
Final Thoughts
This post was inspired by situations I ran into when trying to get XML data off of SQL Server and onto a file share. Hopefully this post helps you avoid some of the issues I ran into. We covered the basics here; there is still a lot of work that could be done to improve this and make it something you might want to run in a production environment. If you wanted to use this in your environment I would suggest looking into the following:
- Using parameters in PowerShell This would allow you to pass in an instance name and output file path.
- Using the asynchronous file target This is a much more efficient method of getting data out of system health, especially if you use the offset method described in the sqlskills.com article below.
Resources
An XEvent a Day (6 of 31) – Targets Week – asynchronous_file_target @ www.sqlskills.com
Windows PowerShell: Defining Parameters @ technet.microsoft.com
query() Method (xml Data Type) @ msdn.microsoft.com
value() Method (xml Data Type) @ msdn.microsoft.com